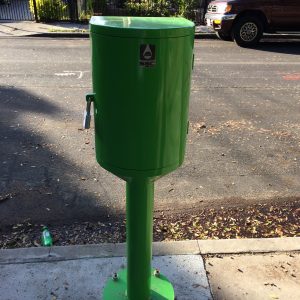
Description
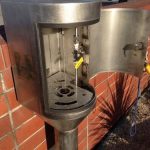
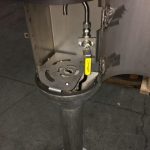
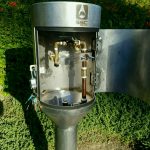
Inside our NDMX model (with sample tap incl.)
Hydraclam® and Chloroclam® Water Quality and Pressure Monitors
Remote control of your data management and its transformation in to more useful forms are key tools for SMART WATER professionals. The web-based user interface is designed to allow customers to analyse their data through automated visualisation tools.
Once sensor and diagnostic data is uploaded to the cloud based system, nodes are mapped geographically, and data is presented as time-series for each instrument. The data is also presented in different visual forms such as turbidity event size, frequency, and duration. For chlorine, disinfectant effectiveness is presented using the concentration size/class analysis tool.


